The hardest times table facts, from three published lists
Three published lists name the times table facts that children get wrong most often: EdShed's, reported by Tes on 20 May 2026 from 249 million answers, and Learning by Questions' (LbQ) lists for 2025/26 and 2024/25. Here they are side by side, counted by table, and set beside England's national multiplication tables check results for 2022 to 2025.
The short answer: every one of the 30 entries sits in the 3, 4, 6, 7, 8, 9, 11 or 12 tables, none in the 2, 5 or 10 tables, and the 7s and 8s have the most, 12 each.
Practise the tables these facts come from
27 of the 30 entries involve the 6, 7, 8 or 9 table. Print a sheet of those four with an answer key, or open one table for its patterns, a memory trick and the facts children miss.
Worksheet: 6, 7, 8 and 9 tablesTry the Year 4 check formatClassroom games and flash cards
The table pages: 6s, 7s, 8s, 9s, 12s, 4s, 11s, 3s. No sign-up, and nothing you type is saved.
The three lists side by side
Each list has ten entries. Row 1 is the hardest in its own list. EdShed prints its ten questions hardest first and gives the share answered wrongly for the top three. LbQ prints ten facts with the last row the most challenging, and gives the percentage answered correctly first time, so its hardest fact is at the bottom of its printed list and at the top of this one.
| Rank | EdShed via Tes, 20 May 2026 (share wrong) | LbQ 2025/26 (right first time) | LbQ 2024/25 (right first time) |
|---|---|---|---|
| 1 | 9 × 6, 27% wrong | 11 × 12, 83.9% right | 11 × 12, 81.5% right |
| 2 | 6 × 9, 26% wrong | 9 × 7, 85.2% right | 9 × 6, 82.5% right |
| 3 | 9 × 7, about 25% wrong | 11 × 11, 85.3% right | 7 × 8, 83.0% right |
| 4 | 3 × 9 | 6 × 8, 87.0% right | 6 × 8, 83.1% right |
| 5 | 6 × 8 | 6 × 9, 87.2% right | 7 × 7, 83.1% right |
| 6 | 7 × 6 | 12 × 7, 87.3% right | 7 × 6, 83.9% right |
| 7 | 7 × 8 | 7 × 8, 87.7% right | 9 × 7, 84.1% right |
| 8 | 8 × 7 | 8 × 9, 88.4% right | 8 × 8, 84.5% right |
| 9 | 8 × 4 | 9 × 4, 89.1% right | 8 × 4, 84.6% right |
| 10 | 4 × 7 | 6 × 12, 89.4% right | 8 × 12, 84.8% right |
The lists measure different things: EdShed's figure is the share of answers that were wrong, from seven years of pupil answers (its average across all questions was 13%); LbQ's is the share right first time, from practice sets that may have allowed longer than the check's 6 seconds. So the percentages are not added, averaged or compared across lists. The easiest question EdShed reports is 11 × 8, answered correctly by 96% of pupils.
Where the lists agree
19 different questions make up the 30 entries, and 17 different facts once the order is ignored. In 19 of the entries, the same question is in another list too. 6 × 8, 6 × 9, 7 × 8 and 7 × 9 are in all three lists once the order is ignored. Written exactly the same way, 6 × 8, 7 × 8 and 9 × 7 are in all three.
| Fact | In how many lists | Which lists | Asked as |
|---|---|---|---|
| 6 × 8 | 3 of 3 | EdShed (Tes), LbQ 2025/26, LbQ 2024/25 | 6 × 8 |
| 6 × 9 | 3 of 3 | EdShed (Tes), LbQ 2025/26, LbQ 2024/25 | 9 × 6, 6 × 9 |
| 7 × 8 | 3 of 3 | EdShed (Tes), LbQ 2025/26, LbQ 2024/25 | 7 × 8, 8 × 7 |
| 7 × 9 | 3 of 3 | EdShed (Tes), LbQ 2025/26, LbQ 2024/25 | 9 × 7 |
| 4 × 8 | 2 of 3 | EdShed (Tes), LbQ 2024/25 | 8 × 4 |
| 6 × 7 | 2 of 3 | EdShed (Tes), LbQ 2024/25 | 7 × 6 |
| 11 × 12 | 2 of 3 | LbQ 2025/26, LbQ 2024/25 | 11 × 12 |
The entries counted by table
An entry counts once for each of its two tables, so 9 × 6 counts for the 6s and for the 9s, and 11 × 11 counts once, for the 11s. That is why the counts below add up to more than 30. Only the 3, 4, 6, 7, 8, 9, 11 and 12 tables appear at all.
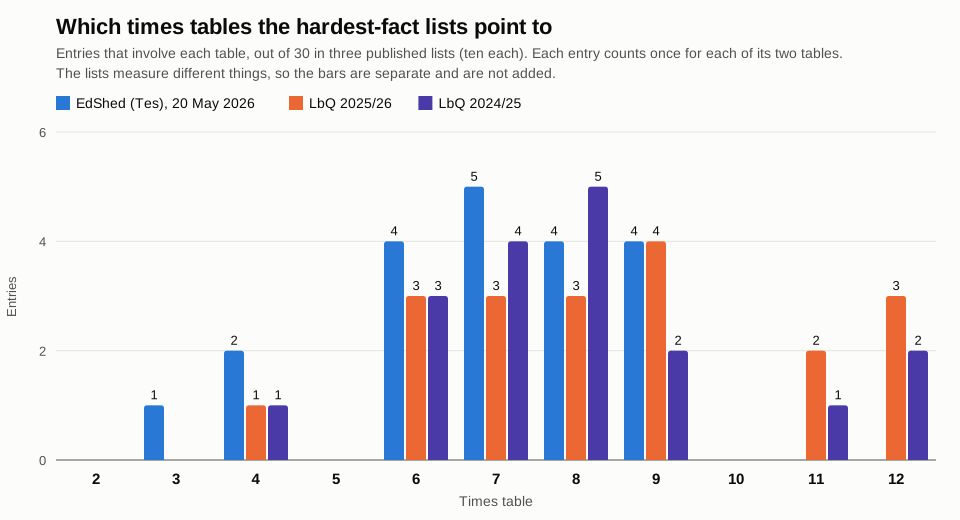
| Table | EdShed 2026 | LbQ 2025/26 | LbQ 2024/25 |
|---|---|---|---|
| 2 times table | 0 | 0 | 0 |
| 3 times table | 1 | 0 | 0 |
| 4 times table | 2 | 1 | 1 |
| 5 times table | 0 | 0 | 0 |
| 6 times table | 4 | 3 | 3 |
| 7 times table | 5 | 3 | 4 |
| 8 times table | 4 | 3 | 5 |
| 9 times table | 4 | 4 | 2 |
| 10 times table | 0 | 0 | 0 |
| 11 times table | 0 | 2 | 1 |
| 12 times table | 0 | 3 | 2 |
The 7s and 8s have 12 entries each, the 6s and 9s 10 each. In the Tes report, EdShed's chief executive, Dr Martin Saunders, said the hardest questions "aren't random" and that they "cluster" in times tables where children have fewer "obvious patterns" to rely on. The report also says facts in the four times table can feel more accessible because pupils can double and double again.
Beside the national results, England, 2022 to 2025
The check's framework says: "There is an emphasis on the 6, 7, 8, 9 and 12 multiplication tables because these have been determined to be the most difficult multiplication tables." In all, 29 of the 30 entries involve at least one of those five tables. The one that does not is 11 × 11 (LbQ 2025/26). The lists and the national results are different measures: the lists say which facts children miss, and the Department for Education (DfE) figures say how pupils scored overall.
| Check taken | Average score, out of 25 | Scored 25 | DfE release |
|---|---|---|---|
| June 2022 | 19.8 | 27% | 24 November 2022 |
| June 2023 | 20.2 | 29% | 23 November 2023 |
| June 2024 | 20.6 | 34% | 21 November 2024 |
| June 2025 | 21.0 | 37% | 20 November 2025 |
The average is for pupils who took the check. The full-marks share is of all eligible pupils, including those who did not take it. Both figures rose every year: the average from 19.8 in 2022 to 21.0 in 2025, and the share scoring 25 from 27% to 37%. The DfE has not published June 2026 results: its release page lists the next release for November 2026. The framework is clear that "there is no standard for the MTC beyond the number and percentage of pupils who achieve full marks."
Practise the facts the way the check asks them
25 questions from the 2 to 12 tables, 6 seconds each, an on-screen number pad, and at the end a list of the facts missed with a link to each table. Choose no timer to go slowly first.
How this was made
Compiled 30 September 2026. The Tes, LbQ and DfE pages were all read on 29 September 2026.
- Copied, then tested. Each list was copied by hand from its source page into a source record, and a test compares the lists on this site with that record, so a change to one side fails the build.
- Ranks. EdShed's order is the order Tes prints. LbQ prints the ten facts with percentages falling down the table and says the last row is the most challenging, so rank 1 is the last row.
- Counting. An entry counts toward a table when either number is that table. Order matters to the sources, so 9 × 6 and 6 × 9 are two entries in EdShed's list. In the table of facts that appear in more than one list, they are one fact.
- What is not done. No percentages are added, averaged or ranked across lists, and no figure is estimated. Only EdShed's top three carry a percentage in the report, and the third is given as "a quarter of the time", so it is shown as about 25%.
- Left out. A school study reported by the Guardian, in which 6 × 8 was wrong 63% of the time, is not used: its page could not be fetched, only a secondary summary, and its scale differs sharply from these lists. Brainster Math and Kid Learning Lab rankings are not used either: no dataset is given.
Download the data
Three CSV files, comma separated, UTF-8, one header row. Every row carries its source and the date.
- hardest-times-table-facts.csv: the 30 list entries with list, source, source date, rank, question, both numbers, the source's percentage where it gives one, and its URL.
- hardest-facts-entries-by-table.csv: entries per table, per list and in total.
- mtc-national-results-2022-2025.csv: the DfE national results for June 2022 to June 2025, with each release date and link.
Cite this page
Suggested citation:
Ansar, R. (30 September 2026). The hardest times table facts, from three published lists. MultiplicationChart.app. https://multiplicationchart.app/hardest-times-table-facts
The percentages and rankings belong to their publishers. When you quote one, credit it as well: EdShed via Tes (20 May 2026), LbQ, or the DfE, with the links under Sources.
Changelog
- 30 September 2026. First release: the three lists side by side, the facts that appear in more than one, entries counted by table (with the chart), the national results for 2022 to 2025, and three CSV files.
This page is updated when the DfE publishes the June 2026 results (its release page lists November 2026) or when a source publishes a new list, and each change is recorded here.
Sources
- Revealed: the trickiest times-table question faced in schools (Kyle Tormey, Tes, 20 May 2026): EdShed's analysis of 249 million answers from over 300,000 pupils over seven years: the ten questions with the highest error rate (read 29 September 2026)
- MTCs 2026: the complete guide (LbQ, Learning by Questions): the ten facts answered correctly first time least often for the 2025/26 cohort (over 4,000 pupils practising in December 2025 and January 2026) and for the 2024/25 cohort (read 29 September 2026)
- Multiplication tables check attainment, England (Department for Education): releases of 24 November 2022, 23 November 2023, 21 November 2024, 20 November 2025 (read 29 September 2026); the release page lists the next release for November 2026
- Multiplication tables check assessment framework, section 5.2.1 (Standards and Testing Agency, updated 2022): the emphasis on the 6, 7, 8, 9 and 12 tables
Last checked 29 September 2026.