Multiplication chart 1-50
A multiplication chart 1-50 is a 50 × 50 grid of products, from 1 × 1 = 1 to 50 × 50 = 2,500. Find one number down the left side and the other across the top: the square where they meet is the answer. Print it below in color, in black and white or blank, on US Letter or A4.
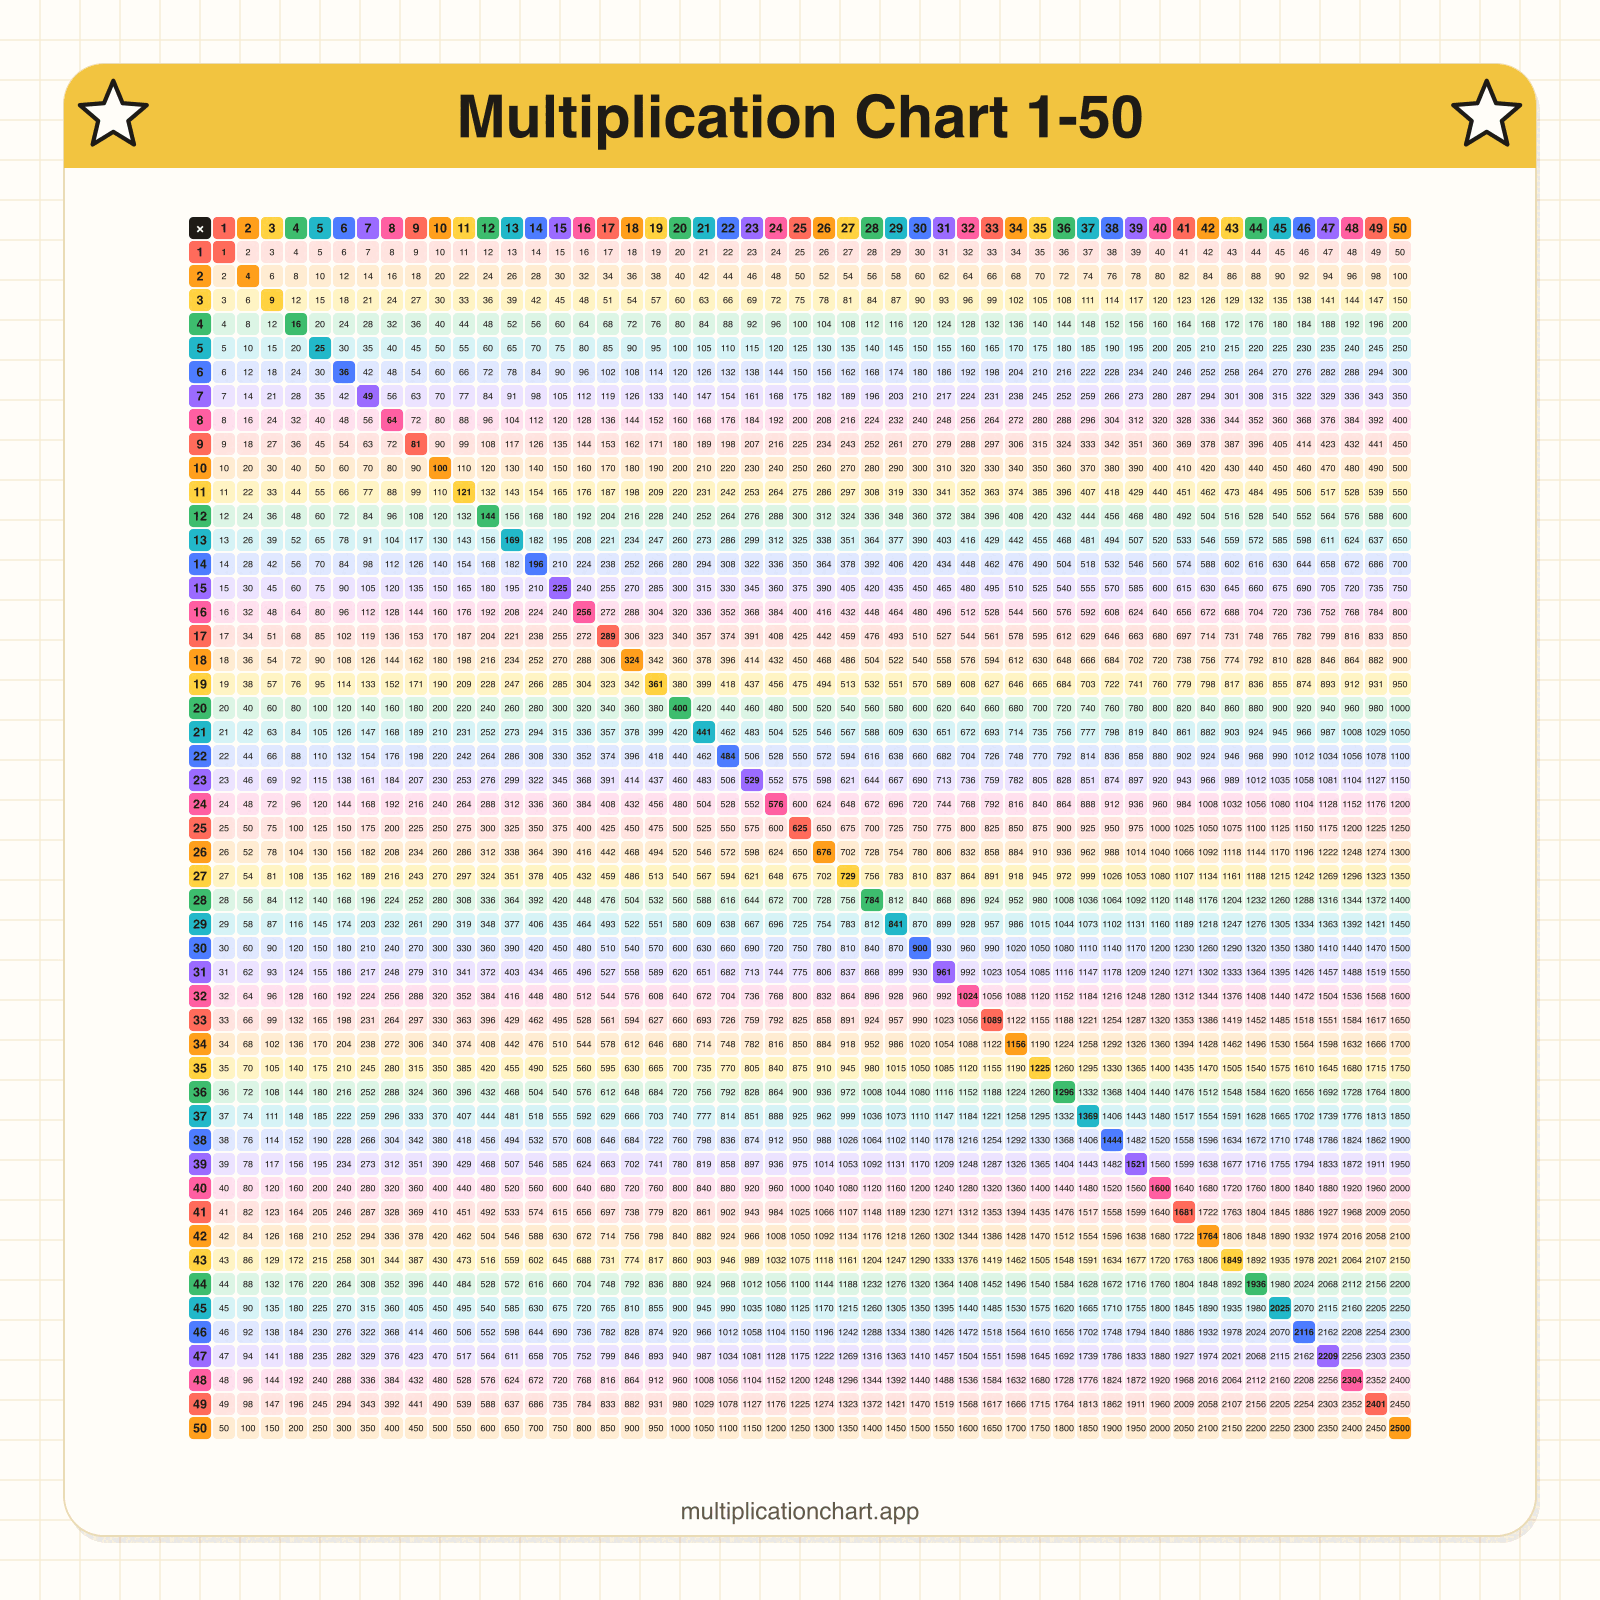
Print the multiplication chart 1-50
On one US Letter page the products print at 4 points, smaller than most printed text, so the one-page chart suits a wall or a binder you read up close. For everyday use, print the large-print version: four pages of 25 × 25 squares with the products at 7.8 points. The blank chart comes as four pages too, because a one-page square (3.7 mm) is too small to write a four-digit answer in.
| Sheet | US Letter | A4 |
|---|---|---|
| Color, one page | PDF (1 page, 159 KB) | PDF (1 page, 167 KB) |
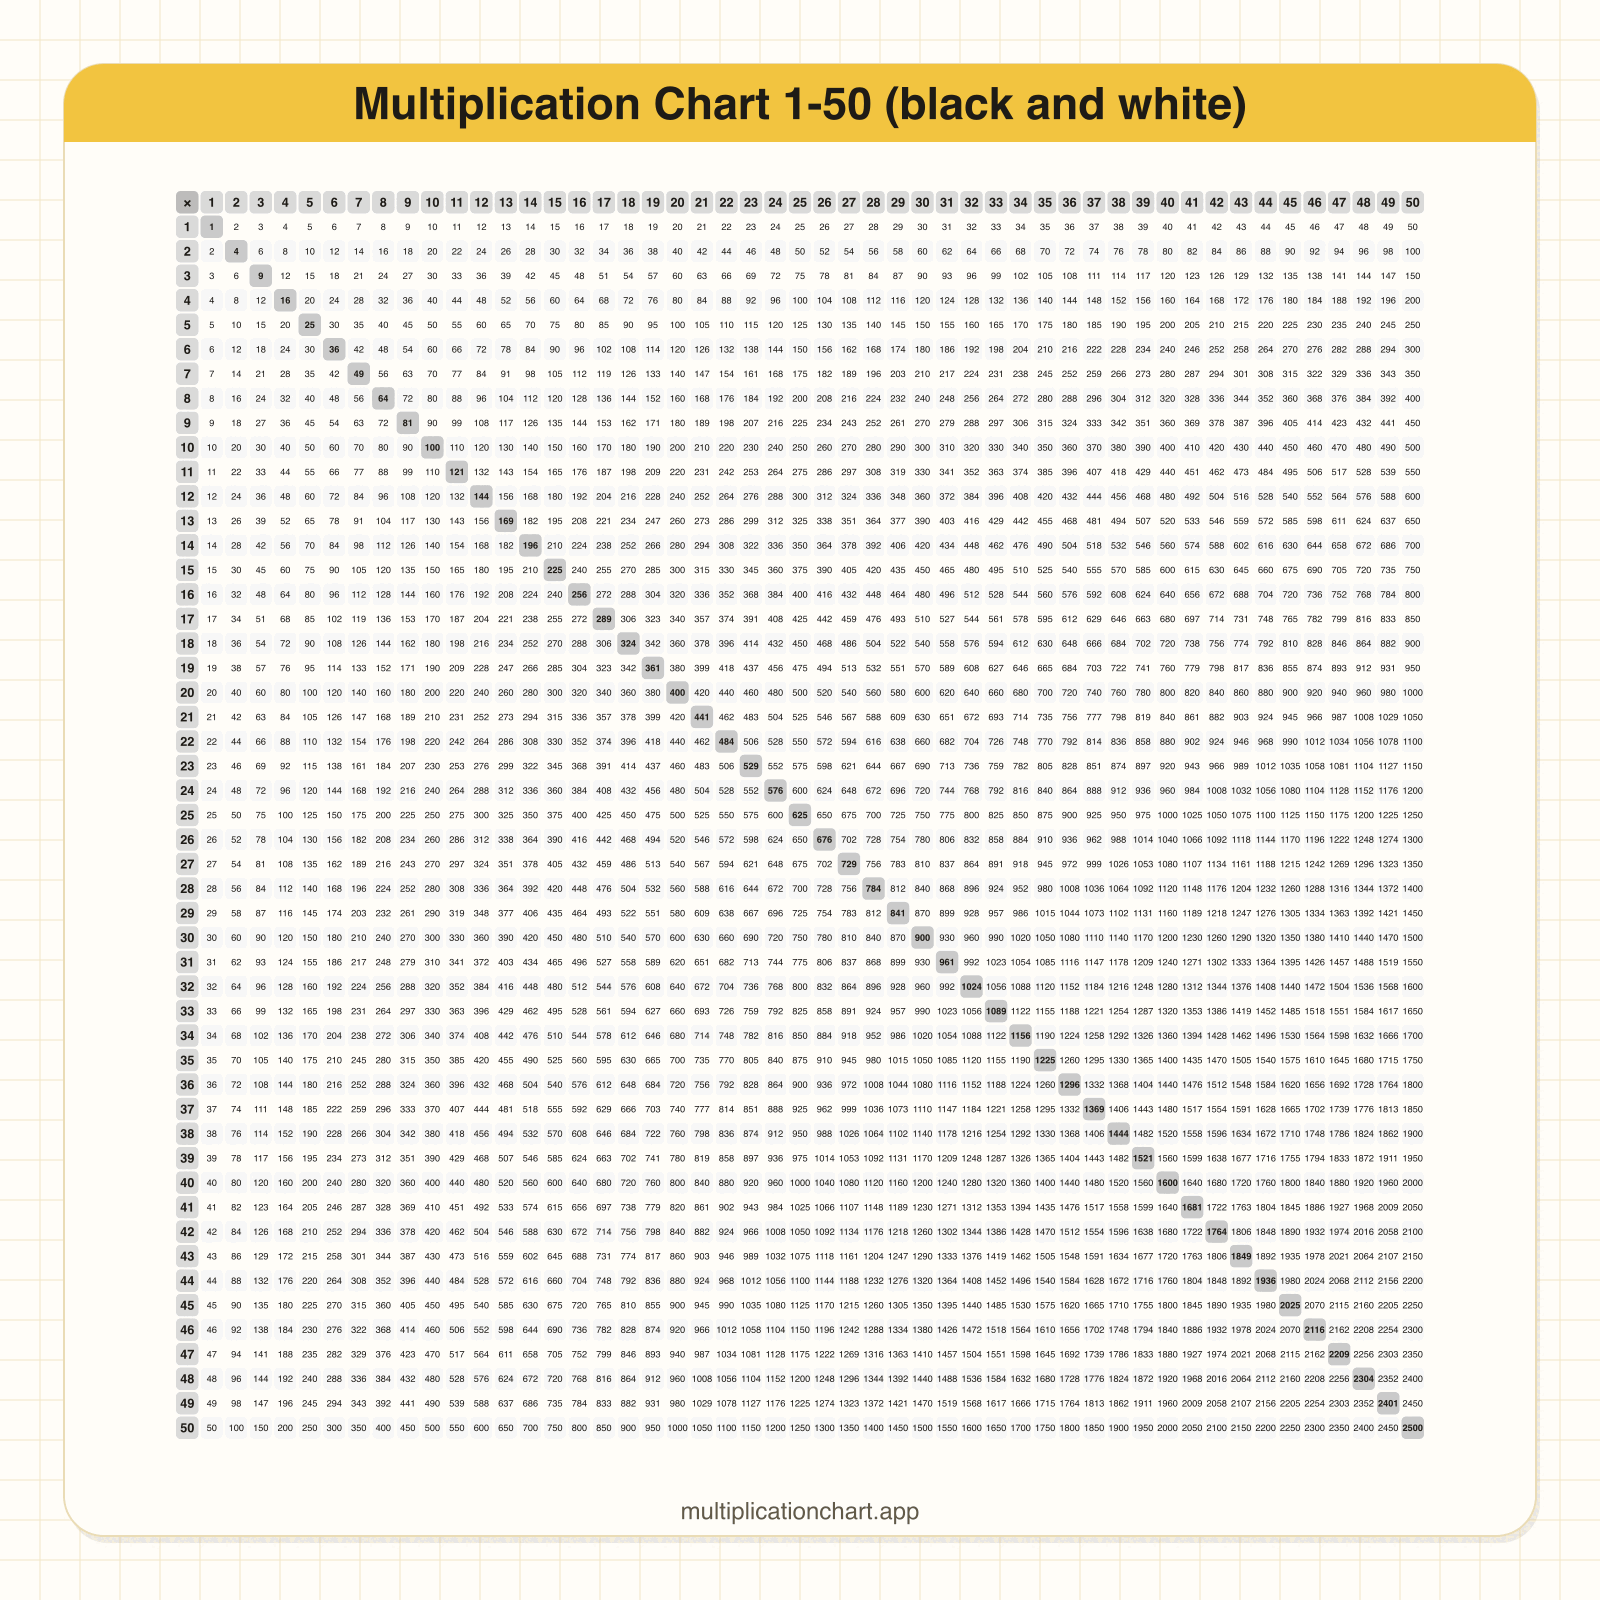
| Black and white, one page | PDF (1 page, 158 KB) | PDF (1 page, 166 KB) |
| Large print, 4 pages of 25 × 25 | PDF (4 pages, 182 KB) | PDF (4 pages, 181 KB) |
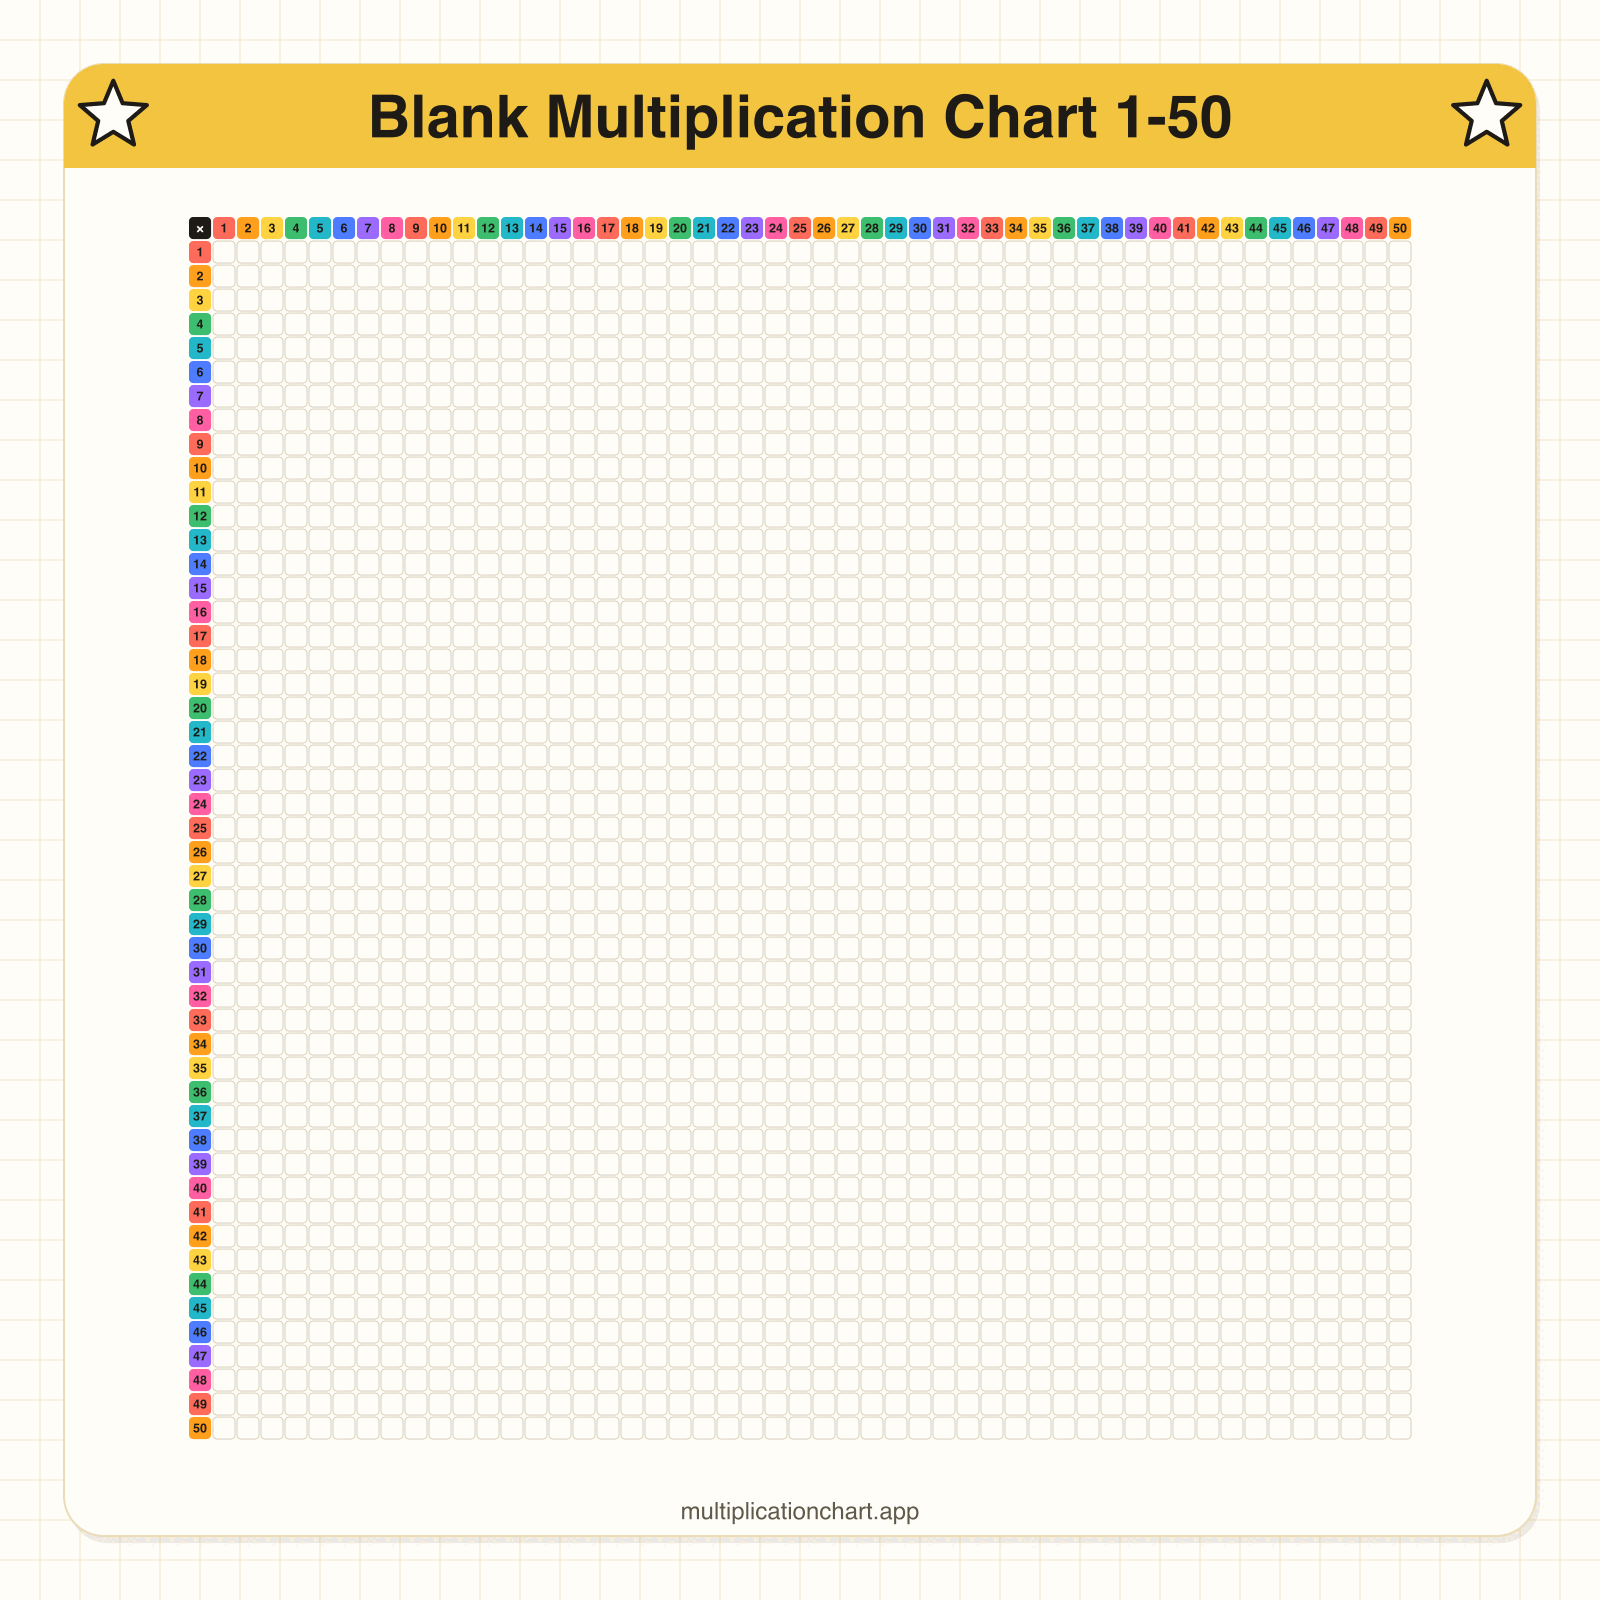
| Blank, 4 pages of 25 × 25, with answer key | PDF (8 pages, 205 KB) | PDF (8 pages, 206 KB) |
Black and white and blank charts
The black and white chart uses gray shading that copies well on a school photocopier. The blank chart keeps the numbers 1 to 50 along both edges and leaves every square empty to fill in.
How to read the 1-50 chart
- Find 47 in the colored column on the left and 38 in the colored row across the top.
- Follow row 47 across and column 38 down. They meet at 1,786, so 47 × 38 = 1,786.
- Division works backward: to find 1,786 ÷ 38, go down column 38 to 1,786 and read the number at the start of that row, 47.
The 1-50 chart in numbers
Our chart generator counted these. We count 47 × 38 and 38 × 47 as one fact, because they match on opposite sides of the diagonal.
| Chart | Squares | Different facts | Different products | Largest product |
|---|---|---|---|---|
| 1-12 | 144 | 78 | 59 | 144 |
| 1-20 | 400 | 210 | 152 | 400 |
| 1-50 | 2,500 | 1,275 | 800 | 2,500 |
| 1-100 | 10,000 | 5,050 | 2,906 | 10,000 |
So the 1-50 chart has 2,500 squares but only 800 different answers. The most repeated answers are 120, 180, 240 and 360, which each appear 12 times.
Square numbers from 1 to 50
The diagonal from the top left corner to the bottom right holds the square numbers, each a number times itself. They are the bold squares on the chart.
- 1 × 1 = 1
- 2 × 2 = 4
- 3 × 3 = 9
- 4 × 4 = 16
- 5 × 5 = 25
- 6 × 6 = 36
- 7 × 7 = 49
- 8 × 8 = 64
- 9 × 9 = 81
- 10 × 10 = 100
- 11 × 11 = 121
- 12 × 12 = 144
- 13 × 13 = 169
- 14 × 14 = 196
- 15 × 15 = 225
- 16 × 16 = 256
- 17 × 17 = 289
- 18 × 18 = 324
- 19 × 19 = 361
- 20 × 20 = 400
- 21 × 21 = 441
- 22 × 22 = 484
- 23 × 23 = 529
- 24 × 24 = 576
- 25 × 25 = 625
- 26 × 26 = 676
- 27 × 27 = 729
- 28 × 28 = 784
- 29 × 29 = 841
- 30 × 30 = 900
- 31 × 31 = 961
- 32 × 32 = 1,024
- 33 × 33 = 1,089
- 34 × 34 = 1,156
- 35 × 35 = 1,225
- 36 × 36 = 1,296
- 37 × 37 = 1,369
- 38 × 38 = 1,444
- 39 × 39 = 1,521
- 40 × 40 = 1,600
- 41 × 41 = 1,681
- 42 × 42 = 1,764
- 43 × 43 = 1,849
- 44 × 44 = 1,936
- 45 × 45 = 2,025
- 46 × 46 = 2,116
- 47 × 47 = 2,209
- 48 × 48 = 2,304
- 49 × 49 = 2,401
- 50 × 50 = 2,500
Tricks for the bigger numbers
- The 50s: Multiply by 100, then halve. 50 × 37: 37 × 100 = 3,700, and half of that is 1,850.
- 41 to 49: Split off the 40, multiply both parts and add. 47 × 8 = 40 × 8 + 7 × 8 = 320 + 56 = 376.
- Just under 50: Use the 50s, then take the extra groups away. 48 × 6 = 50 × 6 − 2 × 6 = 300 − 12 = 288.
- Squares that end in 5: For 45 × 45, multiply the 4 by the next number, 5, to get 20, then write 25 after it: 2,025.
Splitting a number this way is the distributive property, the same idea as Common Core 3.OA.B.5: "Knowing that 8 × 5 = 40 and 8 × 2 = 16, one can find 8 × 7 as 8 × (5 + 2) = (8 × 5) + (8 × 2) = 40 + 16 = 56. (Distributive property.)"
Who needs a chart this big?
In the US, Common Core 3.OA.C.7 ends with "By the end of Grade 3, know from memory all products of two one-digit numbers." In England, Year 4 pupils should "recall multiplication and division facts for multiplication tables up to 12 × 12". Neither goes past 12 × 12, so a 1-50 chart is for looking answers up: checking long multiplication, finding factors and spotting patterns. To learn the facts themselves, start with the multiplication chart 1-12 and the times tables worksheets.
Sources
- Common Core State Standards for Mathematics, Grade 3 Operations and Algebraic Thinking: 3.OA.A.1, 3.OA.B.5, 3.OA.B.6, 3.OA.C.7, 3.OA.D.9; wording checked against the official standards PDF (page 23)
- National curriculum in England: mathematics programmes of study (Department for Education, 2013): Years 2, 3 and 4 times-table statements; Year 5 square numbers
Last checked October 25, 2026.